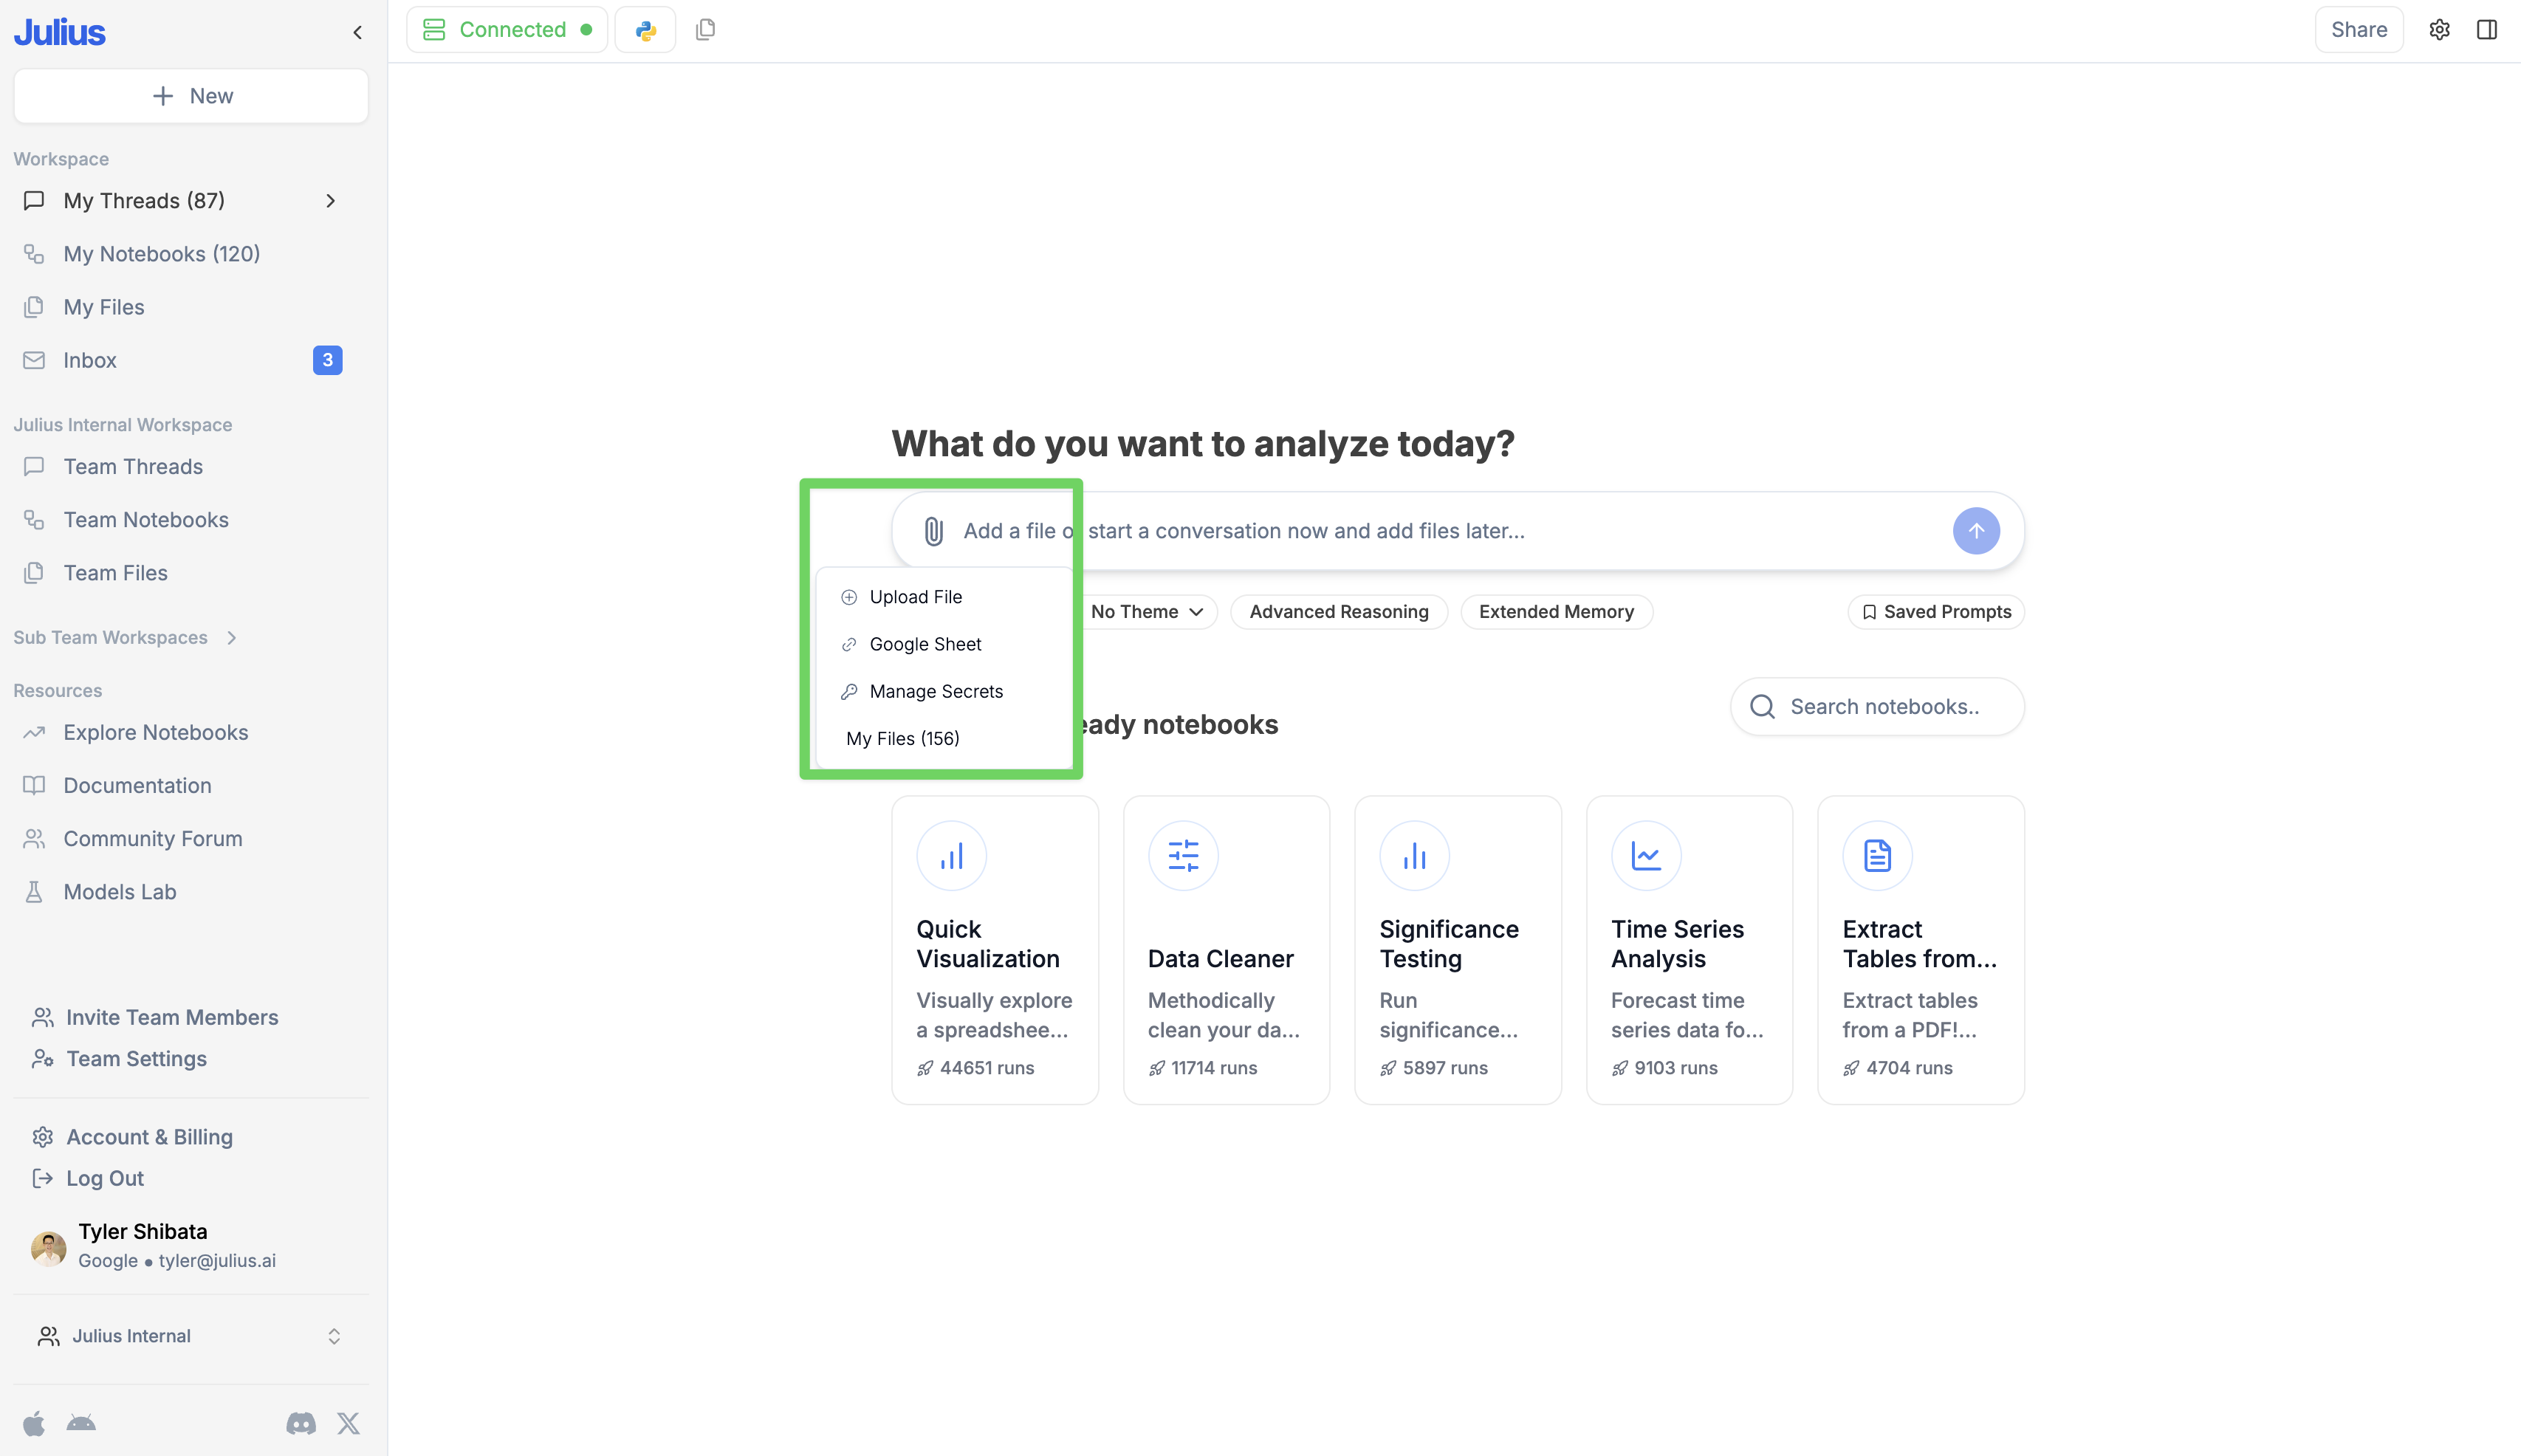
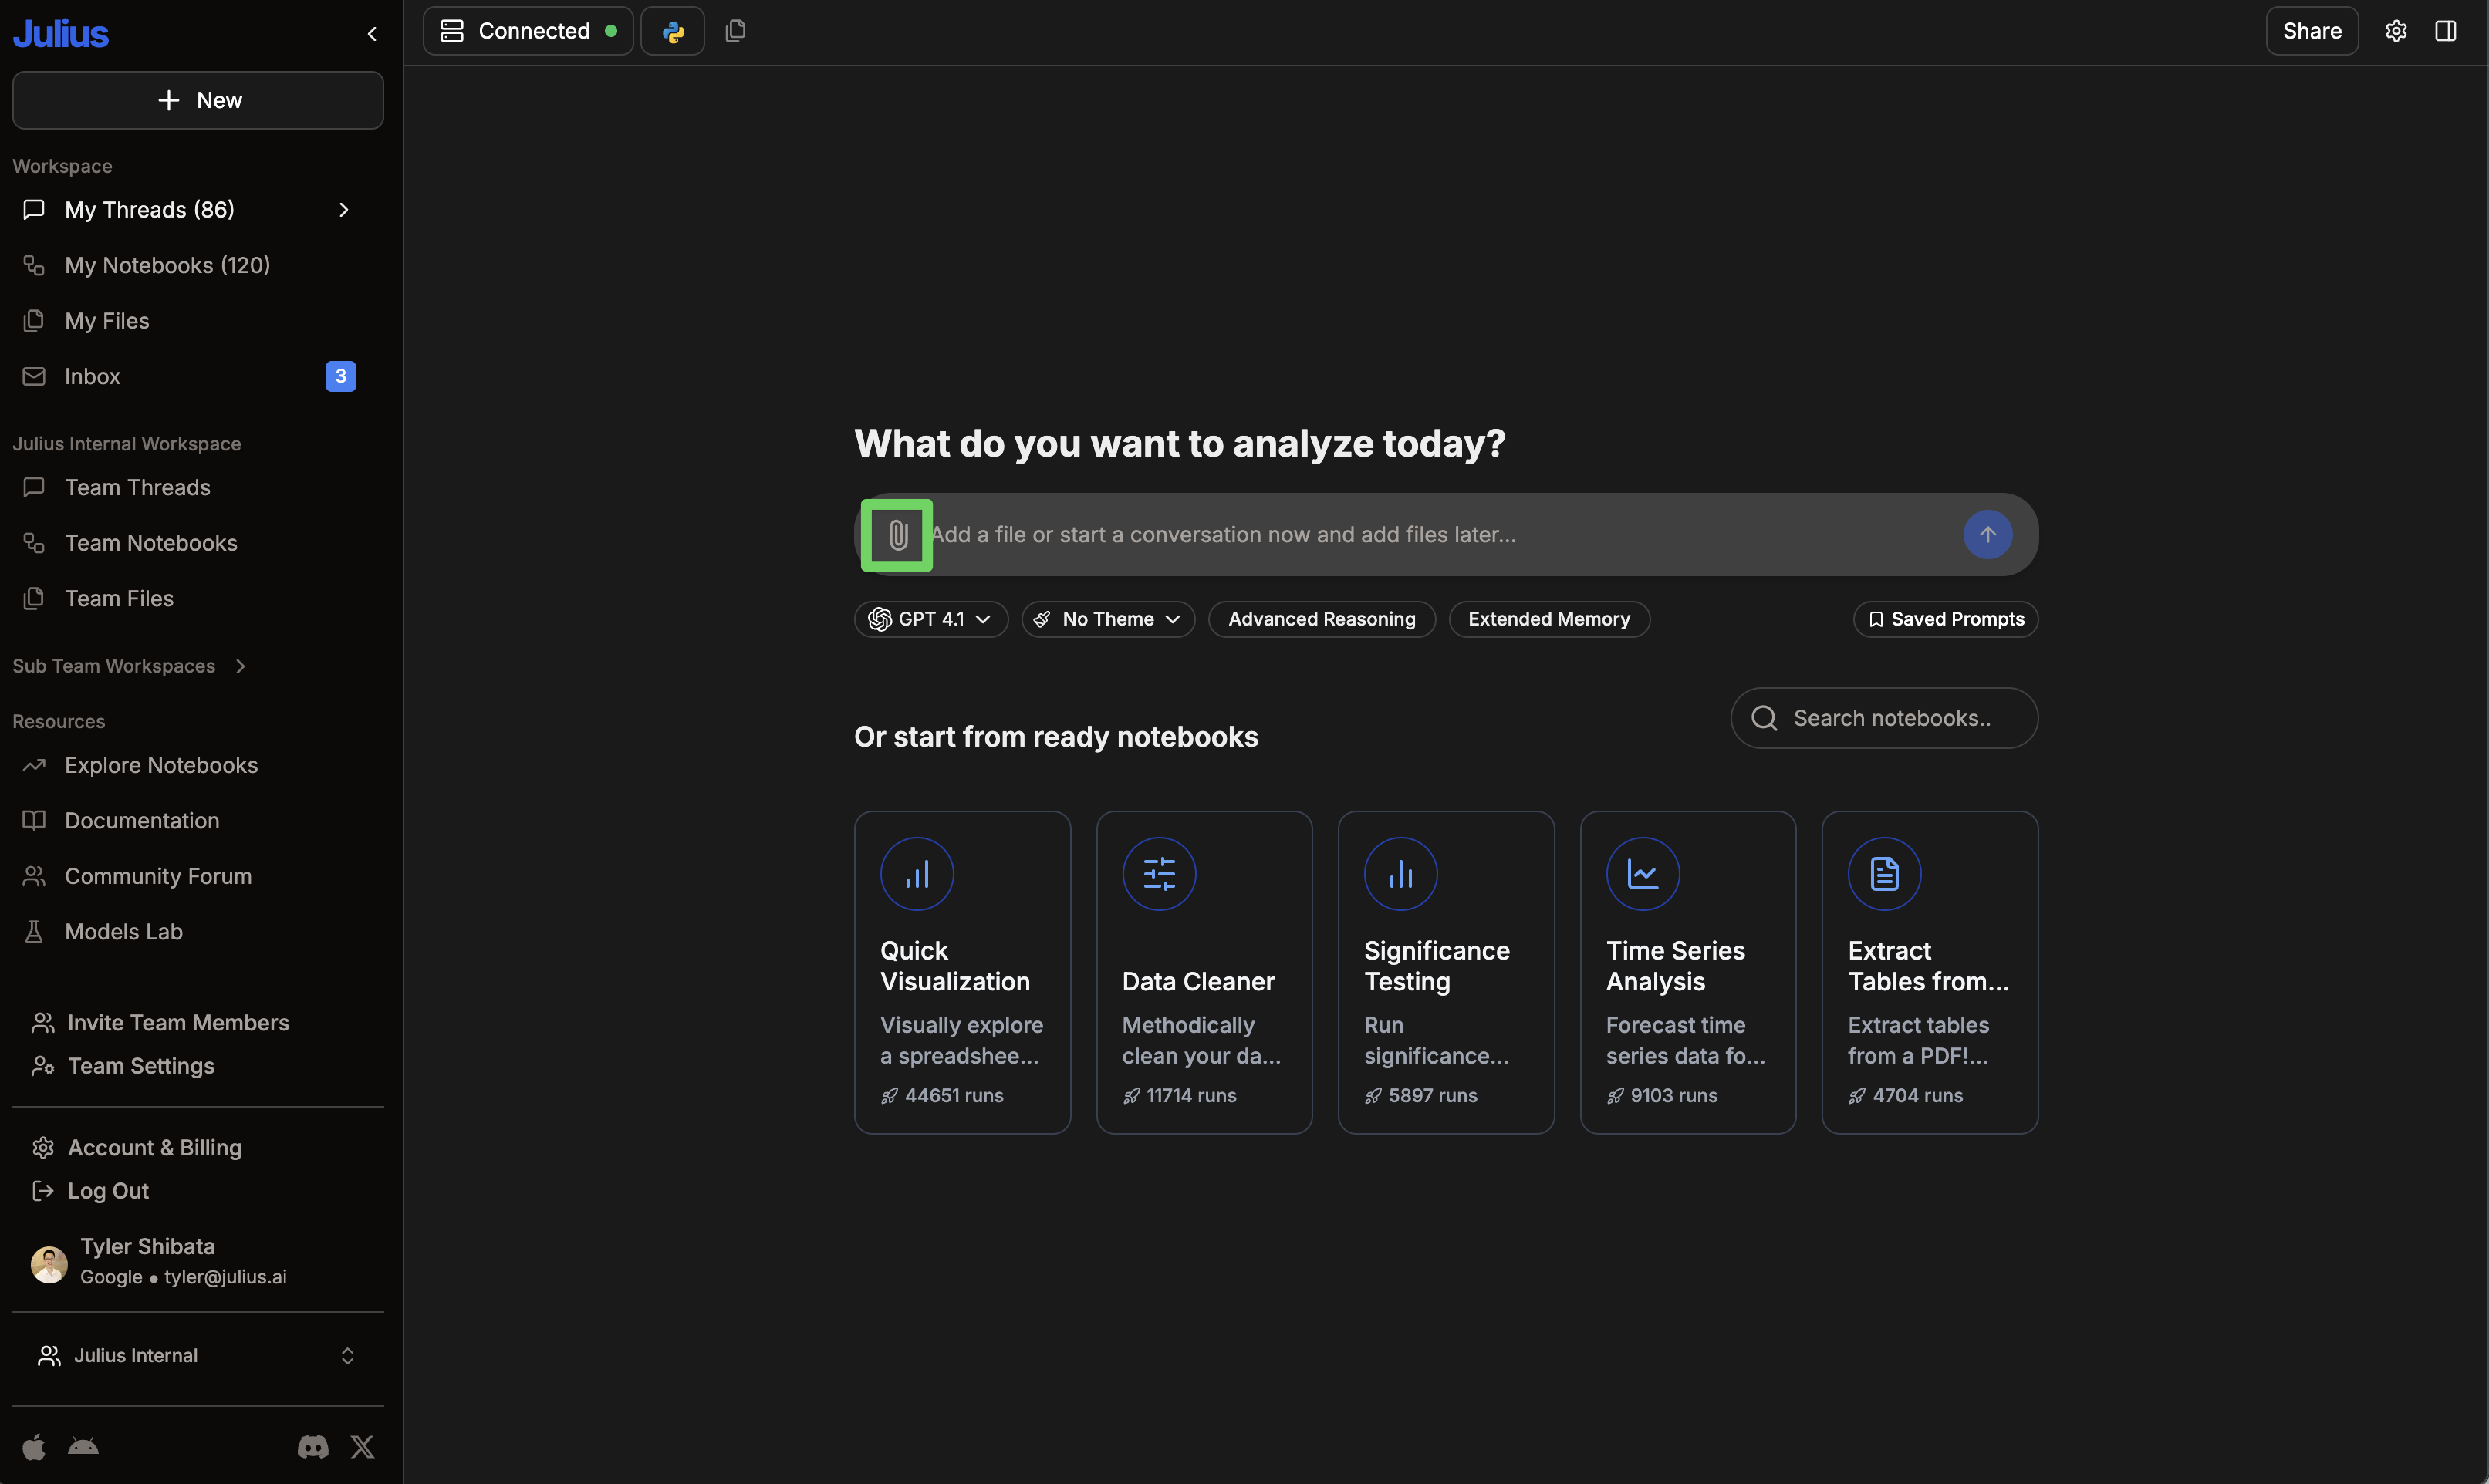
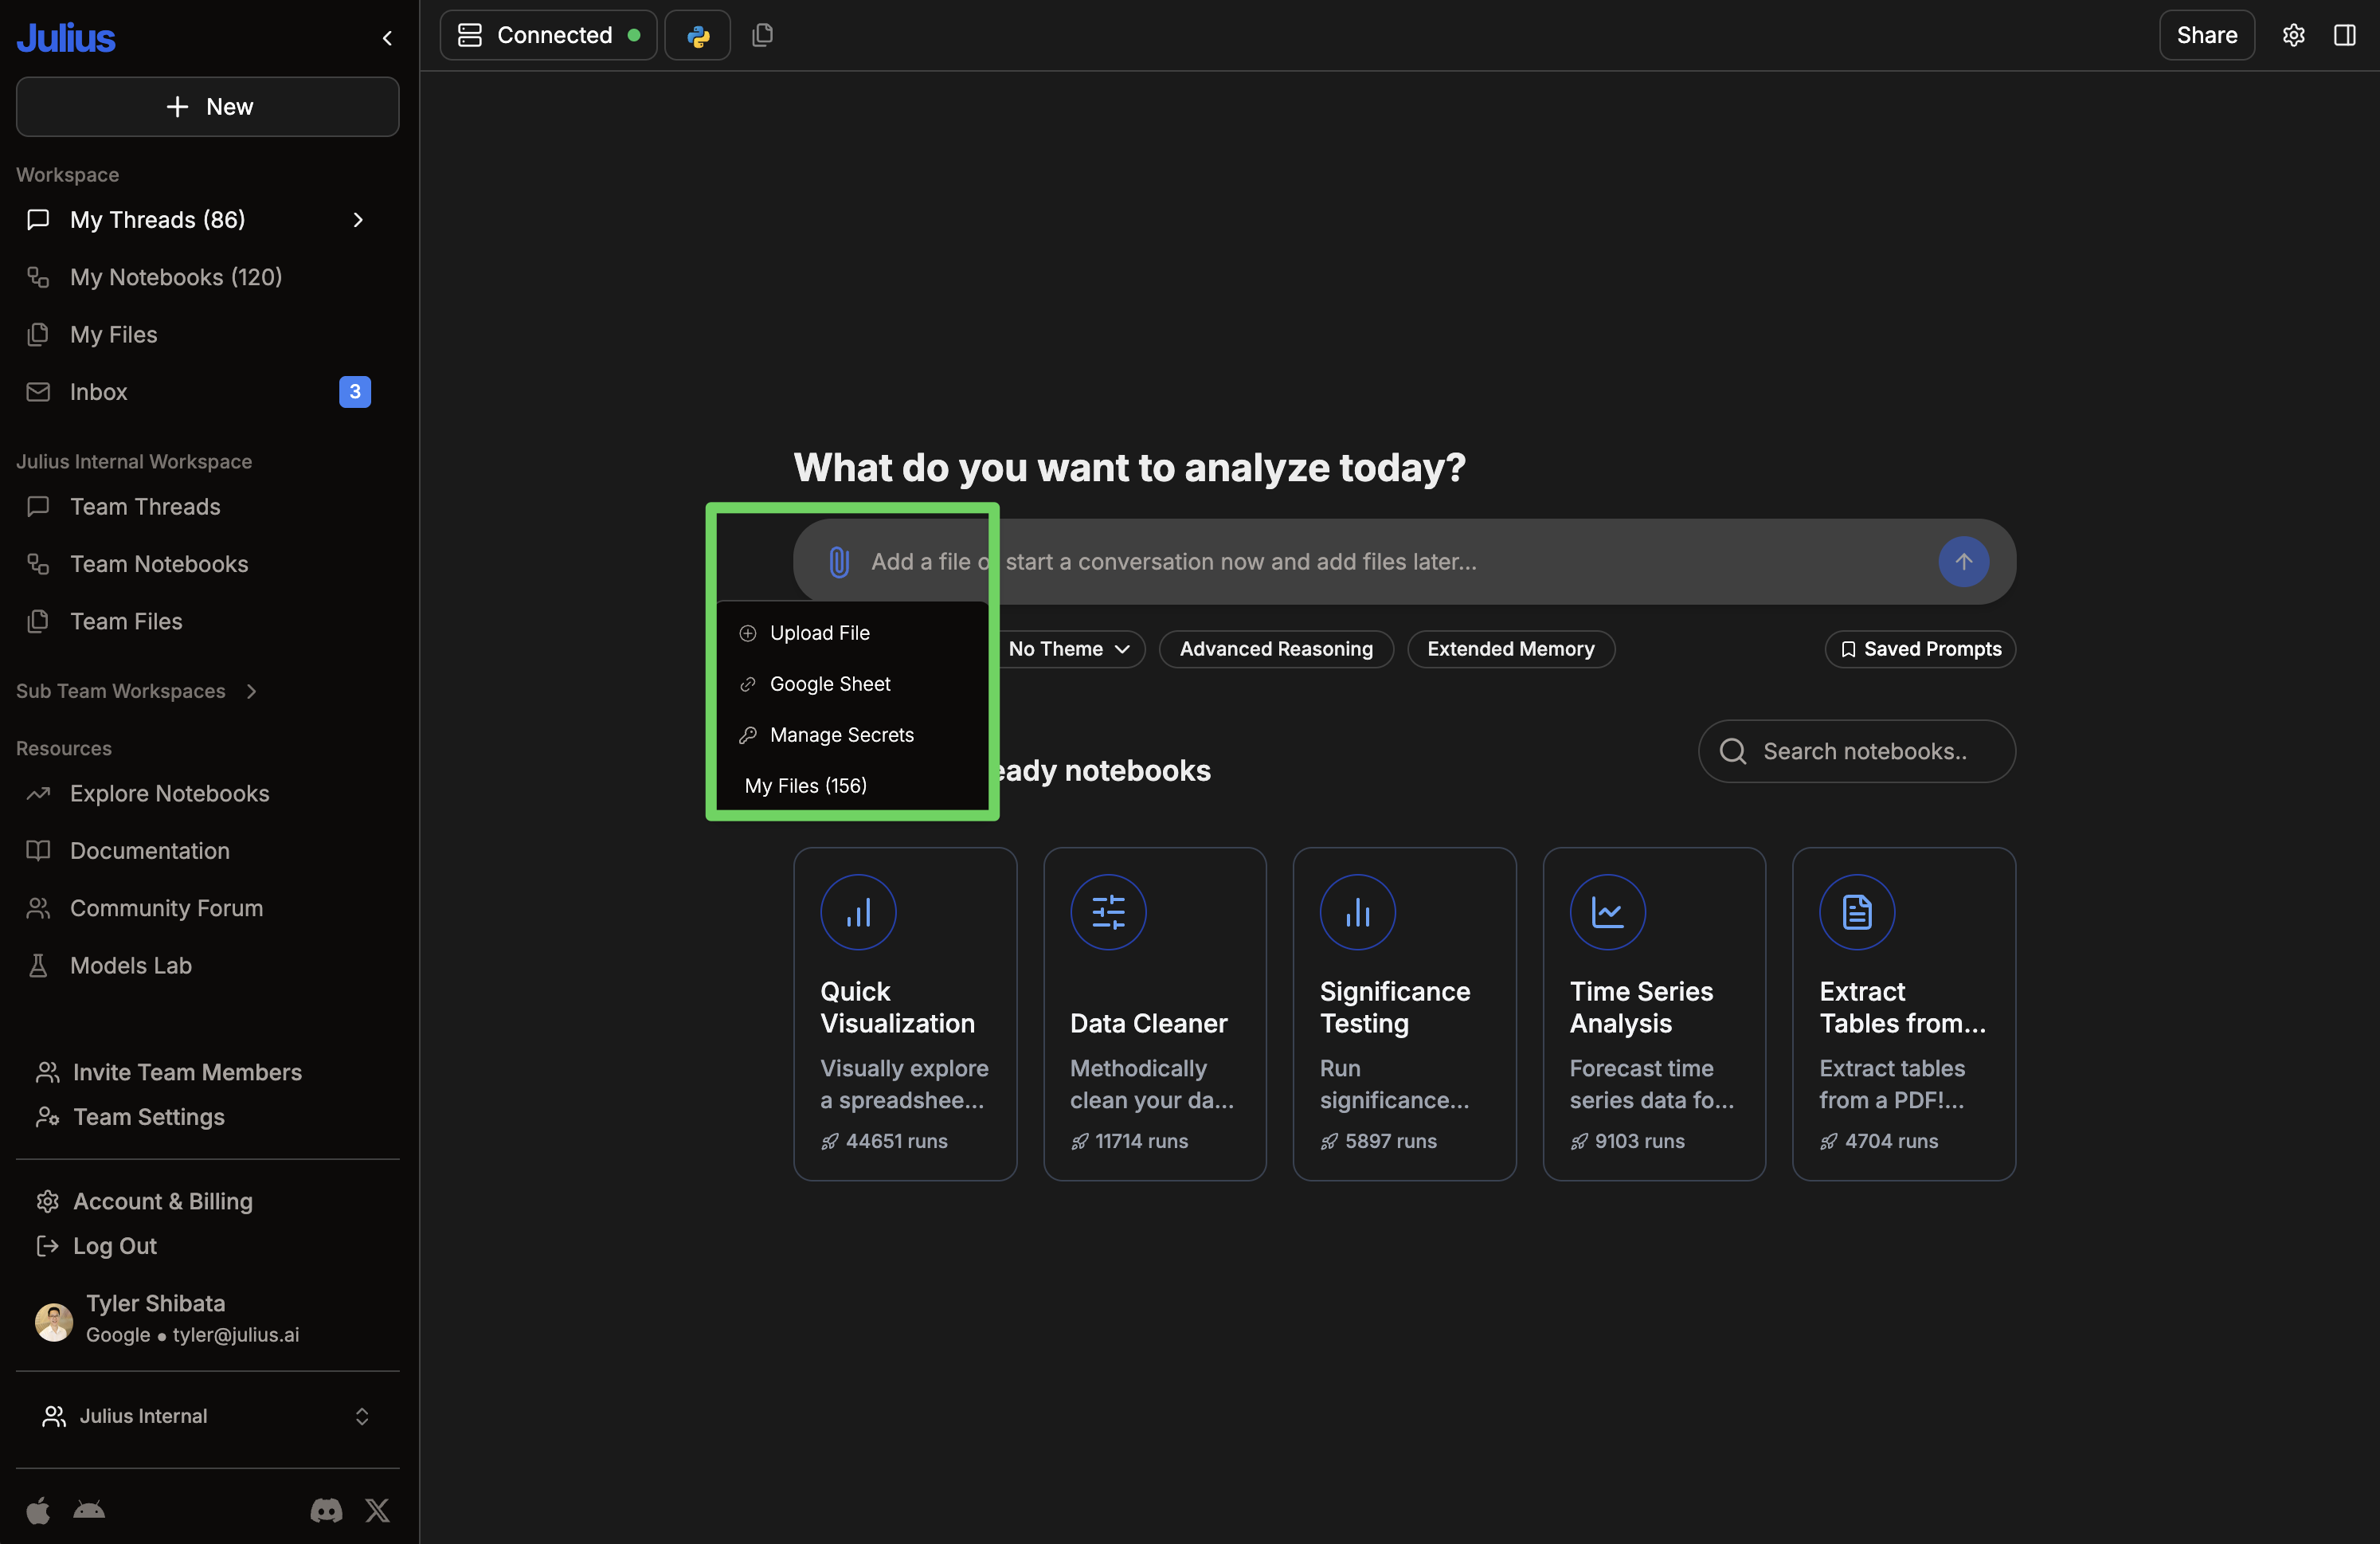
Upload your data
Click the 📎 icon or drag a file into the conversation window. Julius supports CSVs, Excel, JSON, PDFs, images, and more. See Files for the full list.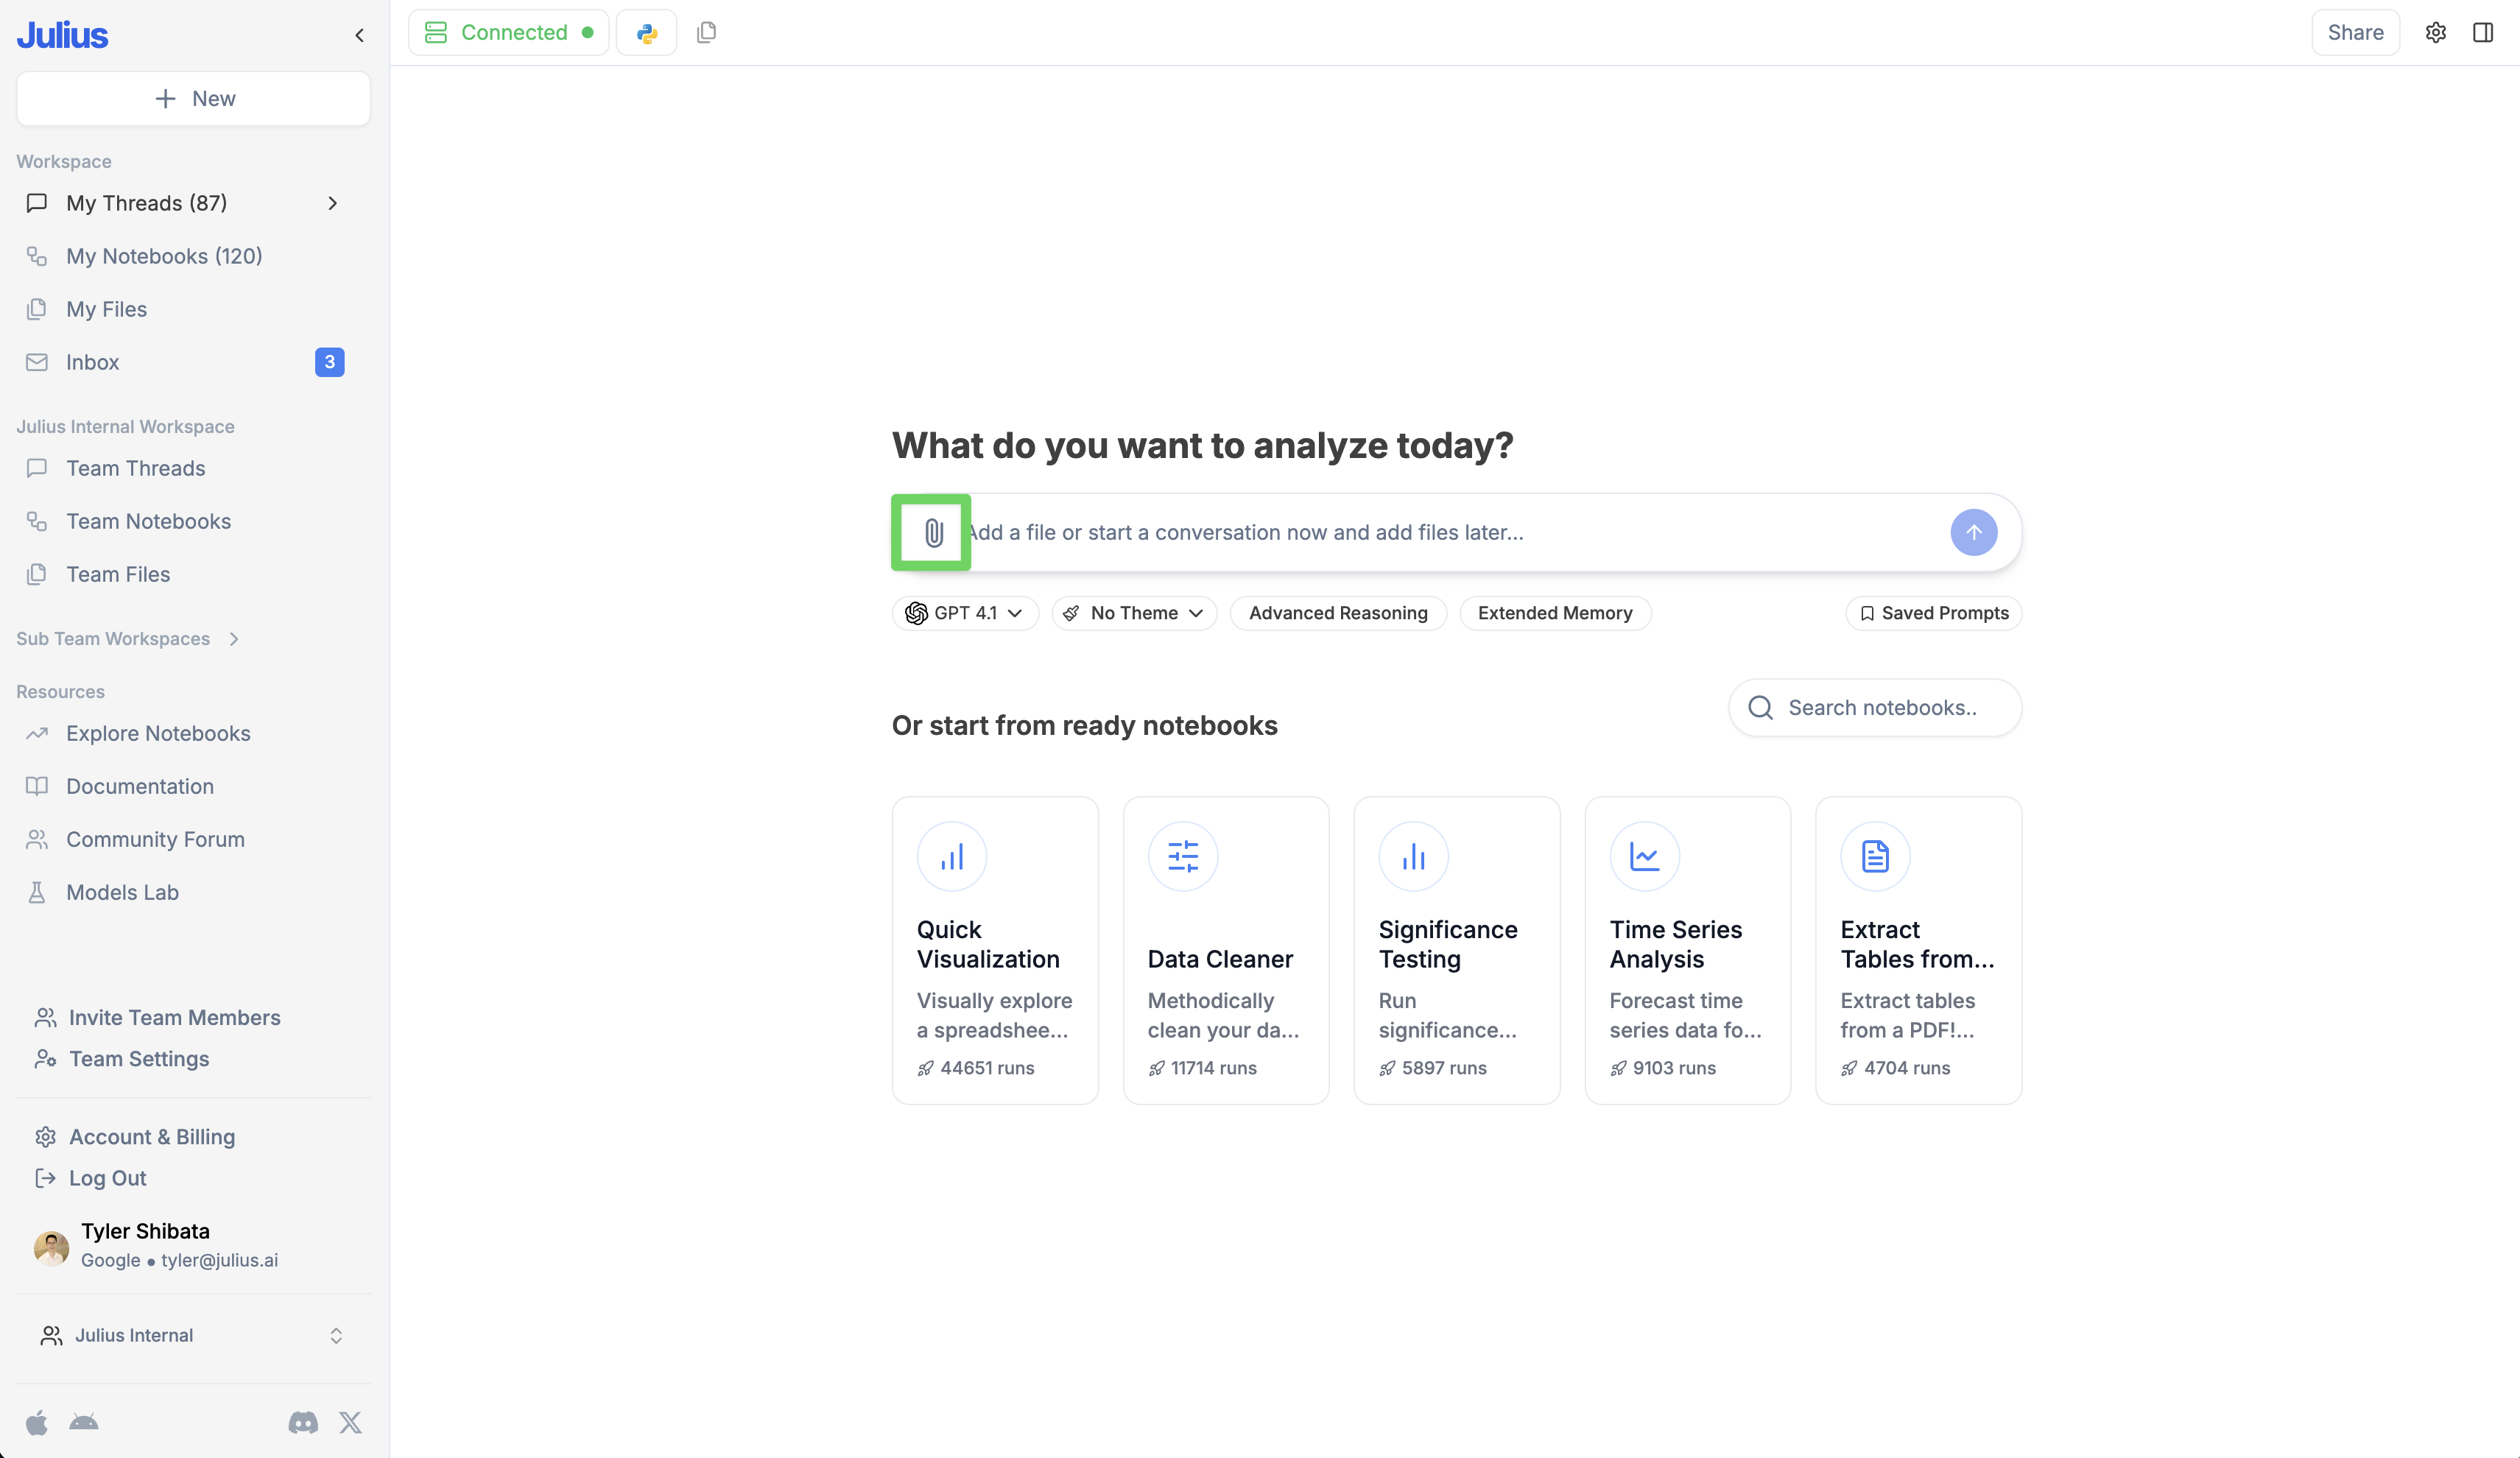
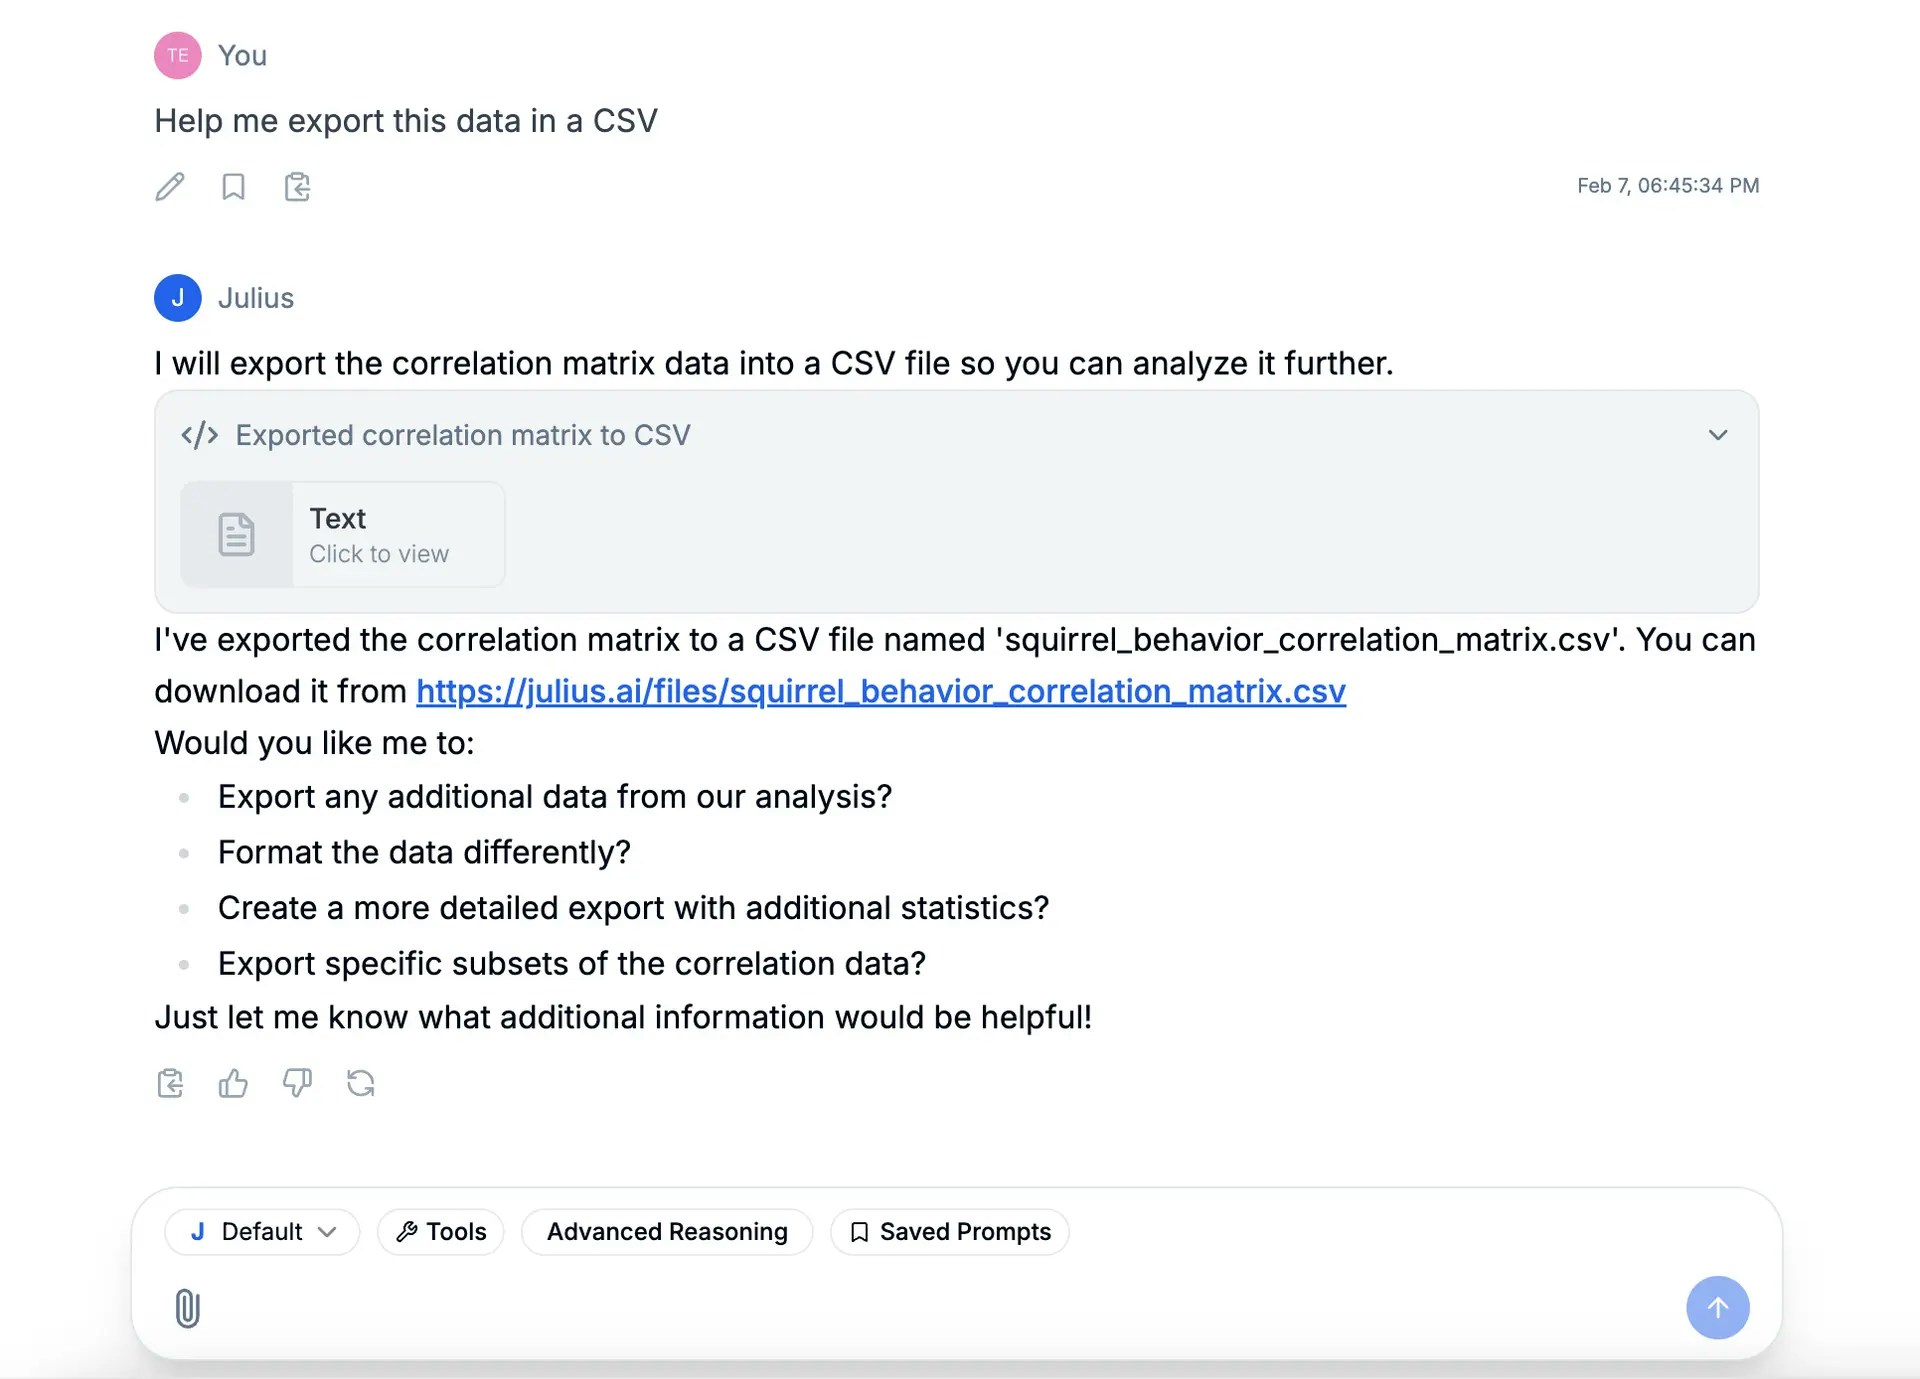
Ask questions about your data
Once your data is loaded, just ask Julius what you want to know in plain language.
Show me the average sales by product category
Sort the data by customer age
Create visualizations
Ask Julius to visualize your data. Just describe what you want to see.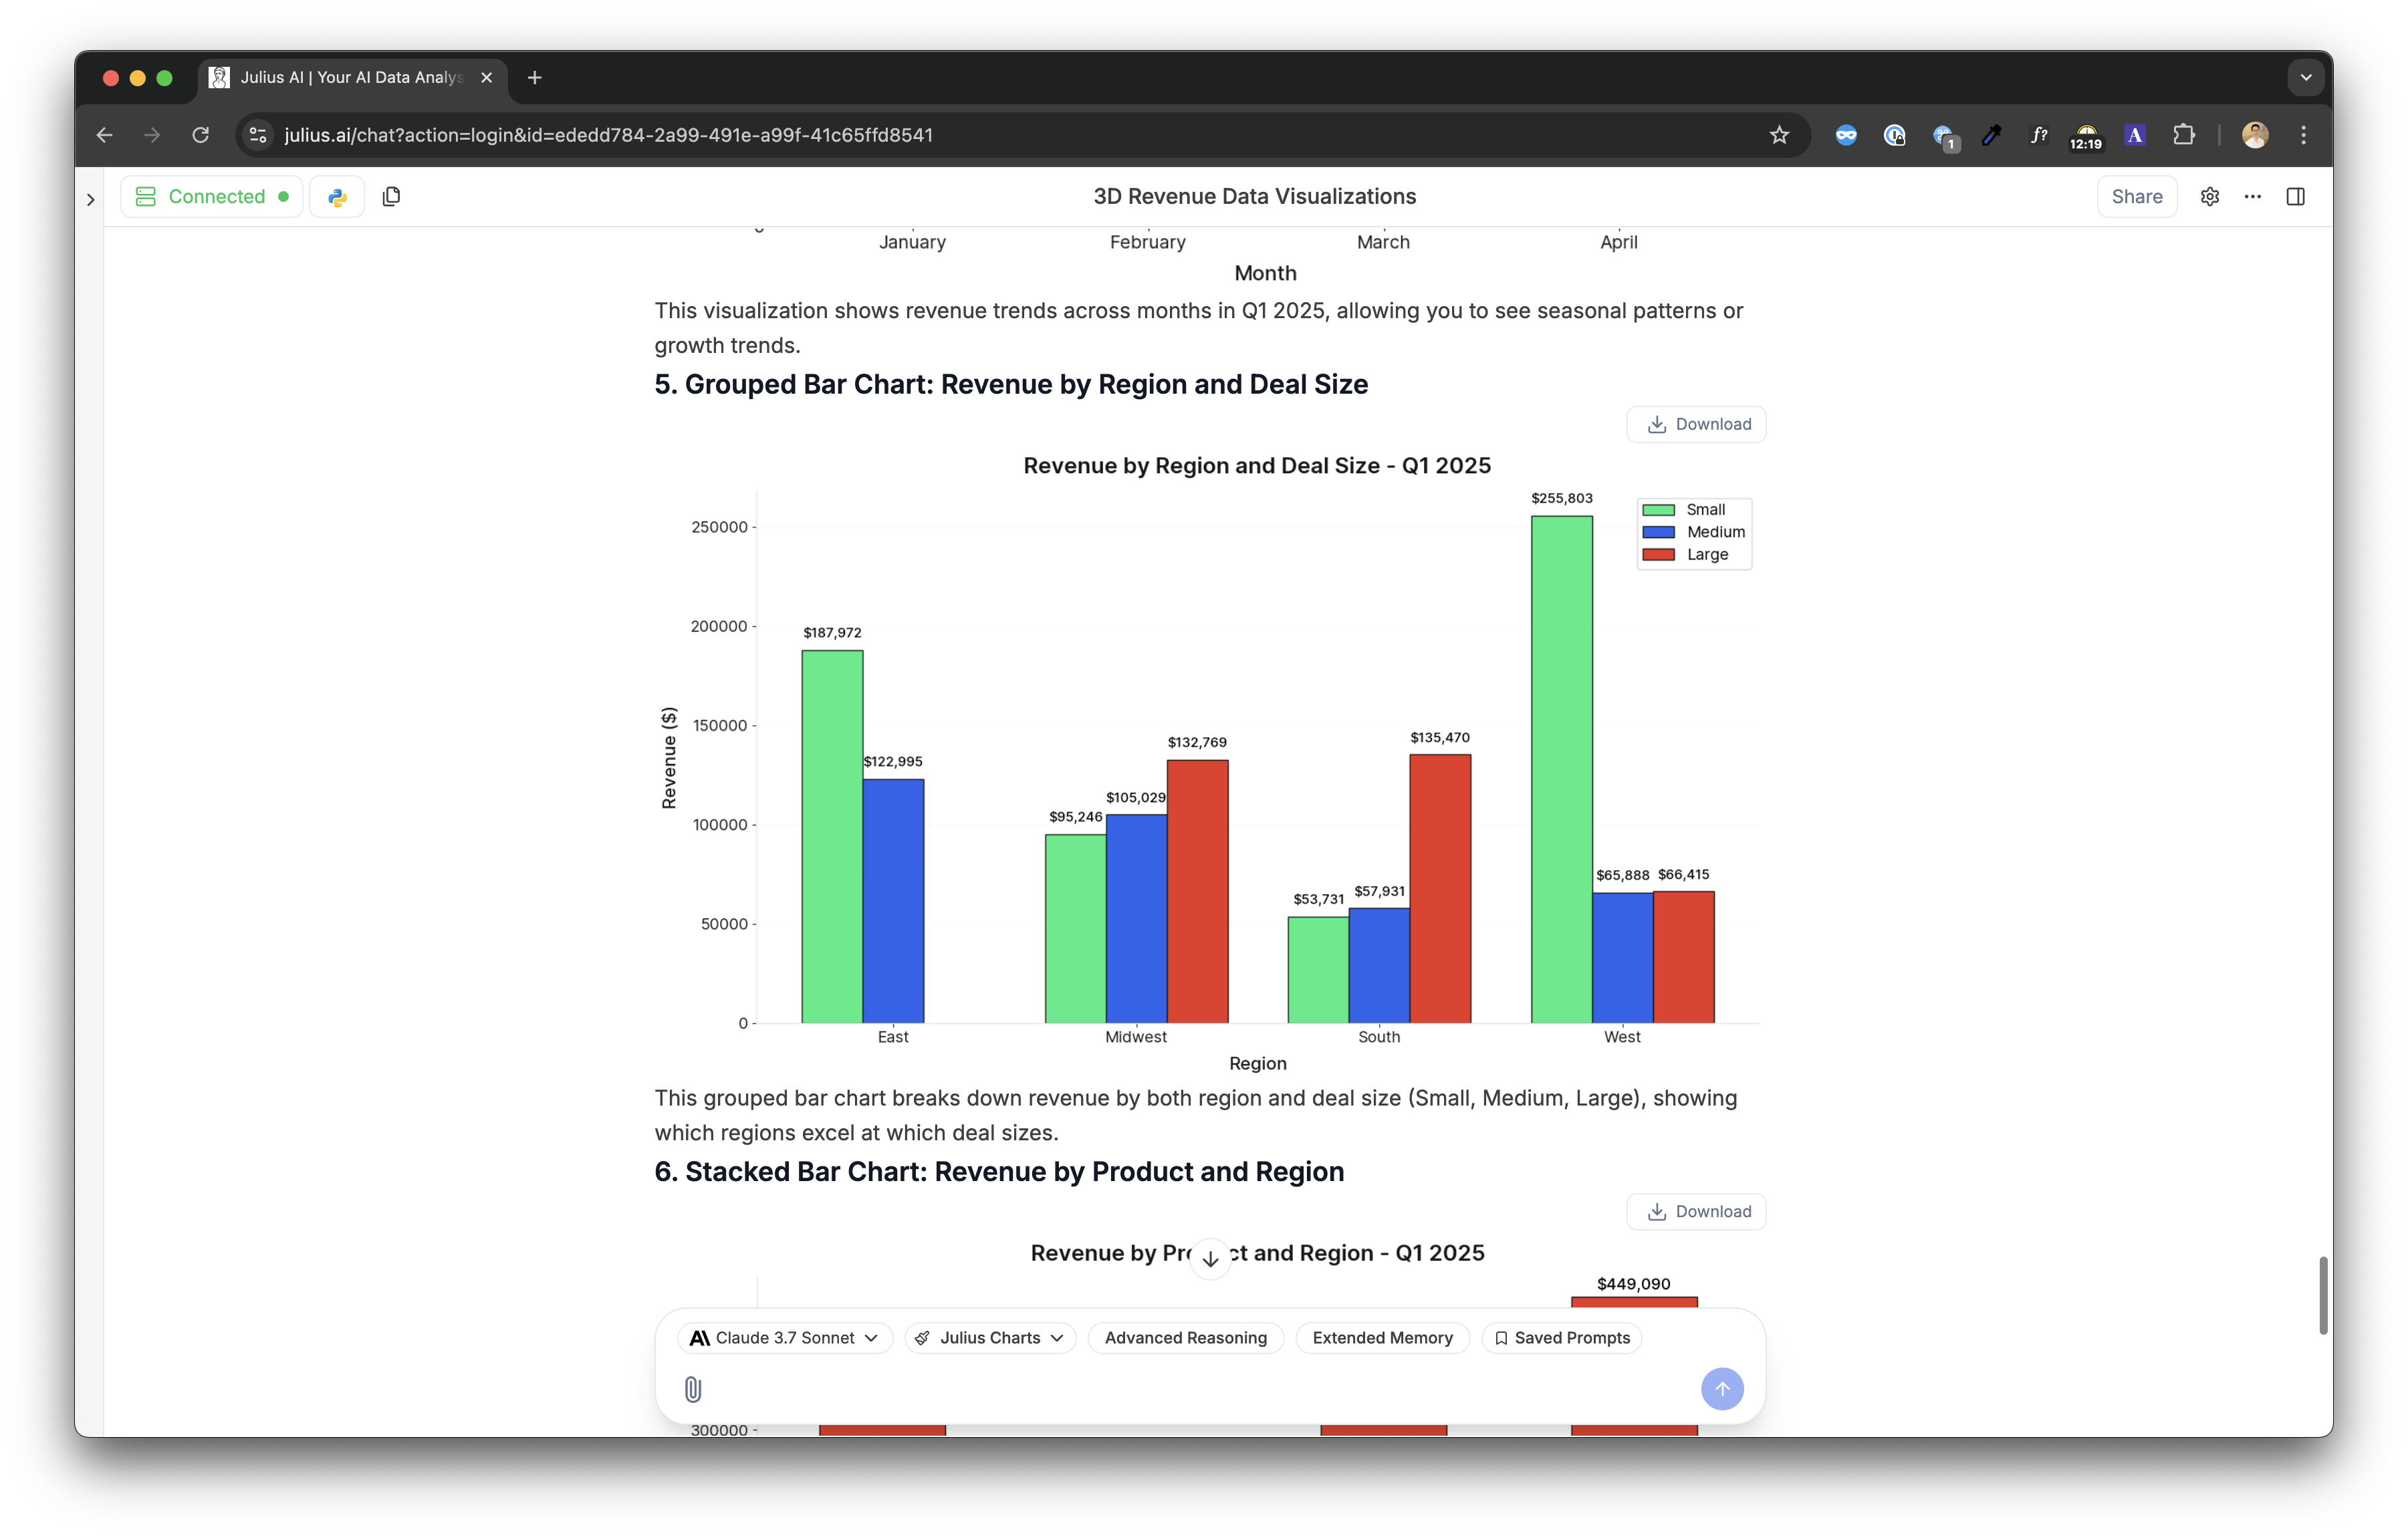
- Bar plots
- Line plots
- Scatter plots
- Histograms
- Pie charts
Compare quantities across categories.
Show me a bar plot of sales by product category